
Data Analysis
After data preparation, the group made principal component analysis as exploratory analysis. To analyze connectivity, usage of different modes of transportation was calculated by zone. The methods includes gravity model, subway network shortest path routing, etc. To analyze economic development and crowding situation, the group also used quantifying economic factors and crowding analysis index.


Subway Entries Analysis
The team use turnstile datasets on the number of people entering and leaving every subway station. Because the entries data is obtained by passenger swiping card, we use the more accurate entries data for analysis.
Stations with higher number of entries are concentrated in southern Brooklyn and most section of Manhattan. Only a few stations in Queens and the Bronx have higher entries.

Busiest Station Analysis
Based on the previous analysis of the turnstile datasets on the number of people entering and leaving every subway station, the team visualize the top 10 busiest and least 10 busy stations.
Because many subway stations have multiple lines passing through, the team divide the total number of passengers at each station by the total number of lines to get the average number of passengers. The stations having higher passenger flow are mainly concentrated in popular areas of Manhattan, such as Wall Street, Soho and east Upper Town, and a few are distributed in Brooklyn and the Bronx.


Public Housing Distribution Analysis
We utilized the NYC housing data to visualize the distribution of low-income units. These low-income units are mainly distributed in Upper Brooklyn, Lower eastern Manhattan, South Bronx, and Eastern Queens.

Crowding Analysis
For crowding, the Straphanger's State of the Subways Report Card crowding index was used create a visualization of the subway lines according to crowd intensity. The location of the most crowded lines was considered in evaluating the hypotheses for new subway lines.


Top Citi Bike Routes
A supplement to the connectivity analysis was isolating the top 100 CitiBike routes, determined by origin and destination stations, in Manhattan (pink) and Brooklyn (purple) overlayed with the subway network.
This illuminates some popular O-D points that are not necessarily served by the subway. For example, we see many paths connecting to the Lower East Side, and many going north-south along the Brooklyn-Queens waterfront.
Routing Analysis
With the routing analysis, we found several shortest paths from the most popular subway stations to the least popular stations. The figures above are two visualizations for the shortest path between the popular and the least popular ones. Finding the optimal route between places where most people live and work and places that are not that developed is crucial for enhancing connectivity. The image on the right-hand side is the optimal route from 86 St(least busy station) to 125 St (most busy station).

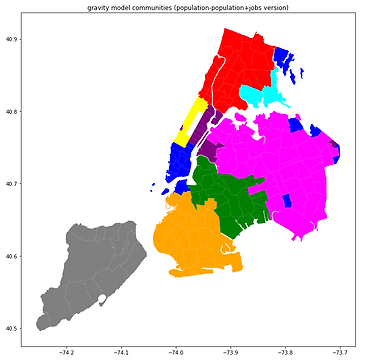
Modified Version of Gravity Model
For now, the gravity model includes population density and job density.Next, the team utilized this model to do mobility predictions and visualize the results on NYC Map to see which districts have similar mobility characteristics. In this map, we found that Wast Queens and East Manhattan have similar colors which means these areas have similar mobility characteristics.
Accessibility of subways and neighborhoods
Based on the top 10 busiest subway stations, we built an interactive map with package Folium and functions including plugins and Circle. In the map, we chose these subway stations as the center and created a circle with a radius of half a block, which is 0.1mile, to ensure that this distance is walkable. The stations having higher passenger flow are mainly concentrated in popular areas of Manhattan, such as Wall Street, Soho and the Upper East Side, and a few are distributed in Brooklyn and the Bronx.

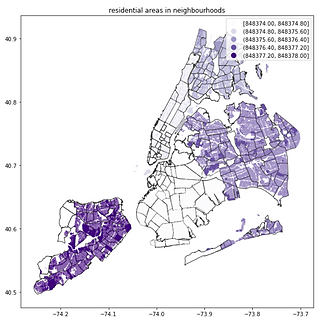
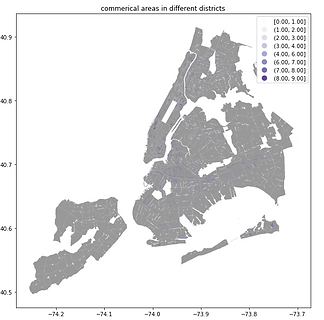

Zoning Analysis
Most of the commercial overlays are distributed around central park, lower Manhattan and the west side of Brooklyn, whereas the residential areas among these places are relatively rare.
Principal Component Analysis
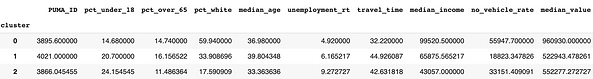
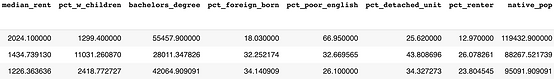
The team obtained the Public Use Microdata Areas datasets, including population, economy, housing and social data. From there, we screened out various demographic data. After standardizing the data, we used Principal Components Analysis for clustering and visualized it in blocks on the map according to the range of PUMA.
Cluster 0 is the area having population with better economic conditions. They have a higher percentage of whites, local population ratio and per capita income, and a lower unemployment rate, rental rates and commuting time.
Cluster 1 is area with the middle class. They are older, less educated, and have a high rate of private car ownership and children carrying. They are a relatively stable middle-aged population.
Cluster 2 is areas where multiple ethnic groups live. They also have a good academic background and income, and also have a high unemployment rate and a high rental rate.


Multimodal Comparison
To analyze connectivity, usage of different modes of transportation was calculated by zone. For subway entries and taxi pickups, the taxi zone was used as a unit of analysis. This is the lowest granularity where we can maintain continuity across the map. Since Citibike has only been available in Manhattan, Brooklyn, and parts of Queens, these were analyzed at the census tract level, which is a geographical subunit of the taxi zone. These three metrics show us where the subway is already heavily used, and where there is supplementary usage of other modes of transport.


